
/ Data & Reporting
Scattered spreadsheets, turned into decisions.
Pipelines, warehousing, Excel automation and dashboards — so leadership sees one set of numbers, every day.
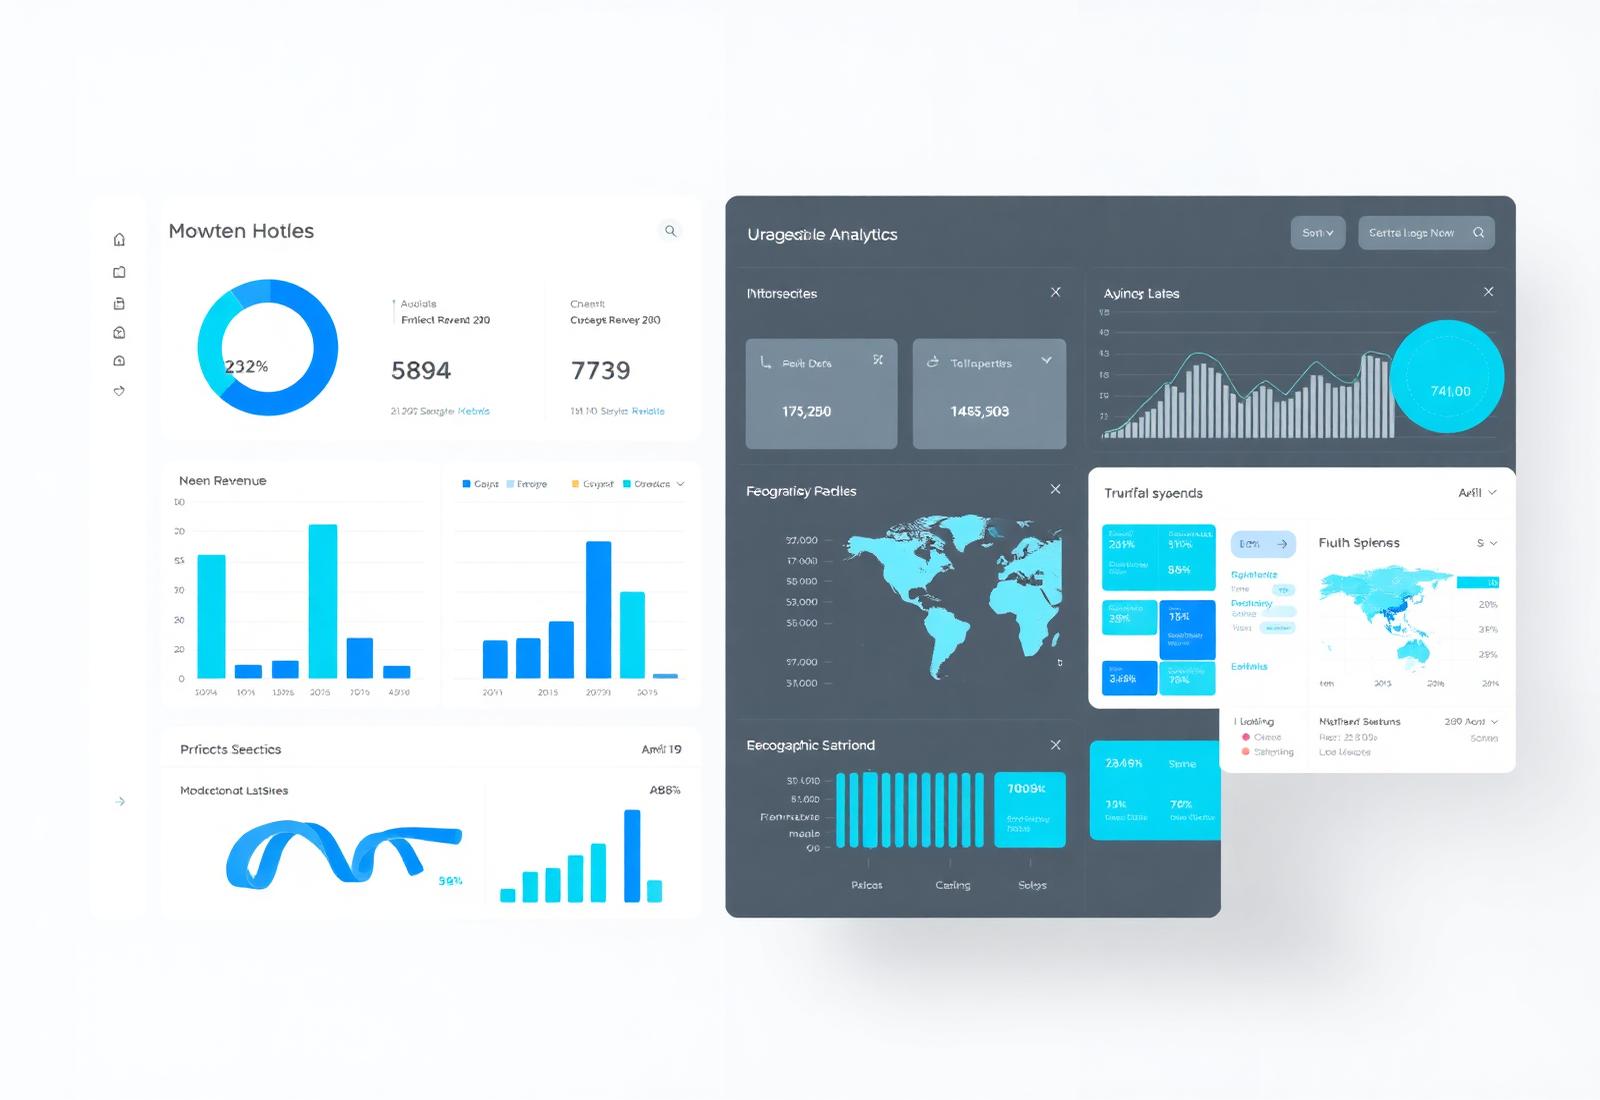
PIPELINES · 01
ETL & Data Engineering
- Extract from ERP, CRM, spreadsheets, POS and third-party APIs.
- Cleaning, de-duplication and validation rules you can audit.
- Scheduled, monitored loads with failure alerts.
WAREHOUSE · 02
Single Source of Truth
- A modelled warehouse so every team reports the same numbers.
- Historical snapshots for trend and variance analysis.
- Role-based access to sensitive financial and HR data.
EXCEL · 03
Excel & Spreadsheet Automation
- Automated workbooks that refresh themselves from live data.
- Macro / VBA and Power Query rebuilds of manual monthly files.
- Templates for budgeting, costing, stock and reconciliation.
MIS · 04
Dashboards & MIS Reporting
- Board-level KPI dashboards, refreshed daily or in real time.
- Drill-down from summary to transaction in a click.
- Scheduled PDF / Excel distribution to stakeholders.
ANALYTICS · 05
Predictive & Advanced Analytics
- Demand, cash-flow and inventory forecasting.
- Margin, churn and productivity analysis.
- Anomaly detection on transactions and stock movement.
CUSTOM · 06
Custom Reports on Request
- Statutory, investor and internal report packs built to your format.
- One-off deep dives when the business asks a new question.
- Ongoing changes handled under an SLA, not a new project.
/ Get started
Send us your monthly file. We'll show you the dashboard.
Most engagements start with one painful spreadsheet. We rebuild it as an automated report, then expand from there.
Talk to our data team→